PE Explorer: Win32 Disassembler
The PE Explorer disassembler is designed to be easy to use compared with other disassemblers. To that end, some of the functionality found in other products has been left out in order to keep the process simple, fast and easy to use.
The disassembler (Ctrl + M, Tools | Disassembler) opens in its own window and overlaps the main interface, which can be toggled back anytime.
The PE Explorer disassembler assumes that some manual editing of the reproduced code will be needed. To facilitate additional hand coding, however, the disassembler utilizes a qualitative algorithm designed to reconstruct the assembly language source code of target files with the highest degree of accuracy possible. While as powerful as the more expensive, dedicated disassemblers, PE Explorer focuses on ease of use, clarity and navigation. We just made a good disassembler at a reasonable price. It will save you hours of time and it's easy to use!
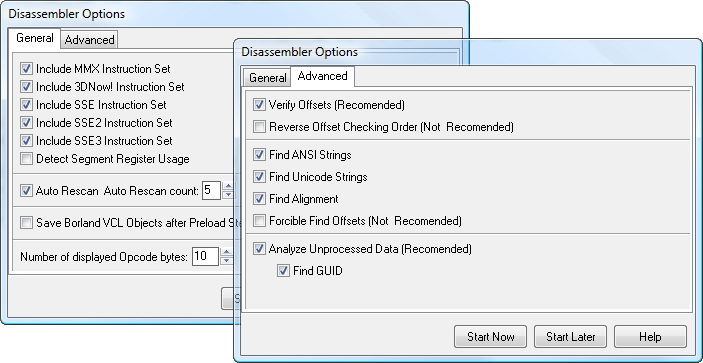
The Disassembler opens a second window. Before the disassembly process the Options window displays the following options:

The disassembler options (View | Disassembler Options) provide with a list of instruction sets to disassemble for. The checked Auto Rescan option and Auto Rescan count value are fine at default values, but for complicated binaries, they may require more passes. The number of displayed opcodes can be set to a default value.
Once you pressed Start Now, the disassembly process begins by identifying the compiler used to build the target file. Forehand knowledge of how a compiler puts files together improves the guesswork involved in determining the data allocation patterns within the target file. Moreover, given this information, identifying most of the objects, procedures, variables, types etc. of the target file can be achieved with a very high degree of accuracy.
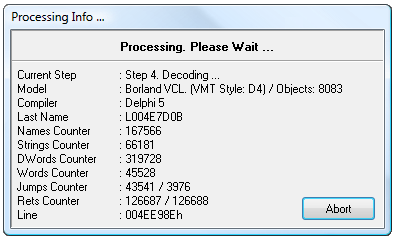
Only various Borland compilers are currently identified. The disassembler will decompile files built with other compilers too. At this time, however, it will only display specifically identified internal items for files compiled with Borland/Embarcadero compilers. During the disassembly process the Processing Info window displays the following information:

Disassembling files larger than 1 Mb in size can take several minutes depending on the capabilities of your system. Generally, each byte of a target file requires 40 bytes of memory for processing. For example, a 1 Mb file would require 40 Mb of processing memory, a 2 Mb file — 80 Mb and so on.
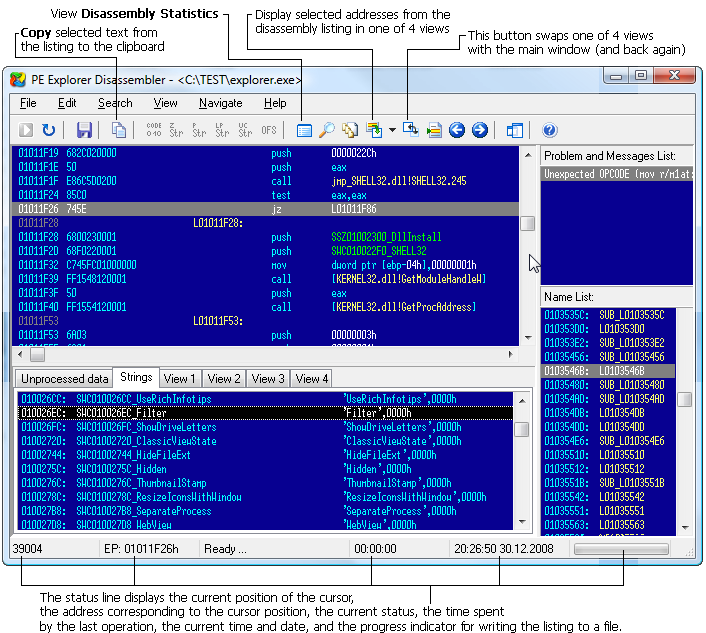
The Disassembler window appears when the disassembly process finishes. The main disassembly view is located at the top-left section. You can adjust the spacing between each assembly line (using 'Ins' and 'Del' keys) and the number of opcodes displayed per line (using 'Shift + Ins' and 'Shift + Del' keys).

After all processing has been completed, the disassembler displays the resulting source code for the target file. This output can be manually edited or saved to disk for future reference.
Navigation is really simple. To move to branching addresses, select the relevant line and press 'Enter'. For instructions with a second operand destination address, press 'Ctrl + Enter'. To backtrack to a previous address, use the 'Esc' key. To visit a specific address, press 'Ctrl + G' and input the address in hexadecimal format.
To list subroutines that might have references, select the starting address of the procedure and press 'R' or access "Search | References". A pop-up window will display the list of referenced addresses, which you can traverse by double-clicking on each listed address. This feature aids in efficiently exploring and analyzing subroutine references within the disassembled code.
Name List to the right provides a list of labeled addresses (including conditional and unconditional branching destinations, function prologues, named data, and string references) by the disassembler, with the entry point clearly indicated. Labels can be renamed by pressing 'N' (Edit | Rename Label).
The lower left tabs View 1, View 2, View 3, and View 4 (F6, F7, F8, and F9) provide persistent disassemble views that are independent of the main view and are swappable.
In the Strings tab, you can find a compilation of detected strings. You can further manipulate string detection using the toolbar or menu items. For instance, you can mark strings as String, Pascal String, Long Pascal String, or Unicode by clicking on the corresponding options in the toolbar or by pressing 'S', 'A', 'L', or 'U', respectively. These features provide powerful tools for efficiently managing and analyzing strings within the disassembled code.
Searching through the strings within an executable file could be a way to get hints about the functionality of a program. With PE Explorer, you can try to fish out the strings that are present in the program, like messages, or something connecting to a URL, etc. When you are looking for leads in the form of text, the output of strings found in the executable gives you a good knowledge of what some of the functions and subroutines called by this binary are.
Code can be manually marked in the assembly listing by pressing 'C'. Dwords and offsets can be marked by pressing 'D' and 'O', respectively.
For adding comments, press ';'. This allows you to include explanatory notes or annotations within the disassembled code for future reference or collaboration with others.
The unprocessed data tab displays some blocks of data that do not have a reference to a procedure.
Although the customized modeling performed by the PE Explorer Disassembler does increase processing time, the result is a dramatic reduction of incorrect opcode translations. We think you will agree that that the extra time needed to achieve this high level of accuracy is justly compensated for by the time saved when hand correcting the output.
Known Limitations
At this time, features in the disassembly implementation do not allow for producing source code that could be recompiled as is. File sections in which the physical size equals 0 and the data is located behind the boundaries of the physical size of the section cannot be accurately translated. The disassembler marks these items [DB Count DUP (??)] and does not place labels inside these areas. These kinds of sections arise because programmers often request memory and then fail to manage it properly, relying entirely on the operating system or the compiler to release the memory resources. For example (in Pascal):
Var MyData: Array [WORD] of Byte;
In this case, the space for storing the variable MyData will not be allocated physically in the data section, but the virtual size of the data section containing it will be increased by a WORD value. It also happens that variables declared in this fashion will result in lost megabytes of virtual space for the containing data section.
At present, due to the features of the internal data structures in PE Explorer and for the reasons cited above, mismanaged memory allocations are excluded from disassembly. Otherwise, the memory expenditure required to process target files could grow astronomically. Currently, each byte of incoming data requires 30-40 bytes of memory to process.
Get Started with a 30-Day Free Trial
Download PE Explorer and start exploring your applications now.
 PE Explorer runs on all versions of Windows, from Windows 95 to the latest version of Windows 11.